Transforming Blockchain Security: Graph Analytics for NFT Transactions
In the complex world of blockchain ecosystems, wash trade detection has become a persistent challenge. However, there's been a game-changing technology that holds the key to unraveling this chronic problem; and that is the graph database technology. This article will explore how graph analytics helps identify and prevent cross-trading behavior within blockchain networks.
What is cross trading in blockchain system?
Through blockchain-based cross-trading, participants gain the ability to directly match buy and sell orders, leveraging the inherent transparency and efficiency of the technology. This approach proves particularly valuable in decentralized exchanges (DEXs), where peer-to-peer trades occur without intermediaries. Nevertheless, it is crucial to acknowledge the presence of malicious patterns in cross-trading within the blockchain ecosystem and that such occurrences can come with risks and challenges. Since blockchain systems facilitate peer-to-peer transactions, they lack traditional rules and regulations . Consequently, individuals intending to engage in cross-trading must exercise caution, as there exists the potential for scams, security vulnerable, and market manipulation.
The impact of the Graph Database Utilization
Graph databases offer significant value, particularly in detecting and monitoring abnormal transactions like cross-trading. Cross-trading transactions can occur at any time, necessitating the implementation of a continuous monitoring system to prevent them. Graph Databases excel at this task, providing an easy and efficient means of detection. As per the detection process, investigating transaction records and identifying the beneficiaries of cross-trading transactions becomes crucial. Detecting these transactions and identifying the involved parties enable graph databases to uncover cross-trading.
Consider the following scenario: a token purchase involving suspicious behavior, where the token holder appears to be engaging in abnormal cross-trading. Flagging tokens associated with suspected transactions will establish a sophisticated surveillance and trading system by providing detailed insights. Furthermore, graph databases prove highly effective in managing transaction histories and tracking costs associated with token purchases. As user transactions are fundamentally interconnected, leveraging the capabilities of graph databases allows for easy querying and examination of all individuals involved in a particular transaction.
Intuitive visualization to understand Cross trading behaviour
Intuitive visualization plays a crucial role in comprehending cross-trading behavior. When a cross-trading transaction is detected, the associated data often presents complex transaction details, making it challenging to determine where to begin the analysis. Interpreting abnormal transactions can be daunting, but graph visualization enables a more accessible and intuitive process. By representing the transaction history as a network of interconnected nodes, the causal relationships become concise and easier to observe, facilitating a deeper understanding of the behavior at hand.
Easy real-time detection, thanks to schema flexibility
Efficient and timely anomaly detection is crucial for effectively addressing and resolving issues. The quicker we identify patterns and anomalies in real time, the more swiftly we can respond and minimize potential damage.
Graph database minimizes the delay
The key to achieving this lies in the flexibility of the schema, which enables easy and seamless real-time detection. In a structured data setting, a transaction requires significant time to search the entire history and analyze additional relevant data during the recording and analysis process. In contrast, a graph database provides a more efficient and time-saving approach as it does not rely on structured data formatting. By eliminating the time to search through the entire transaction, the graph database allows for faster recording and analysis of detections.
Graph Analysis Results
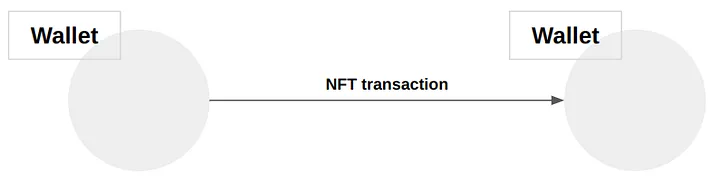
Effective utilization of a graph database requires careful planning for converting your data into graph structures. In detecting cross-trading transactions, the objective is to detect cross-trading transactions through graphs. In this approach, wallet addresses serve as nodes, while the relationships between these nodes, represented by NFT transactions, are depicted as edges, as illustrated in Figure 1.
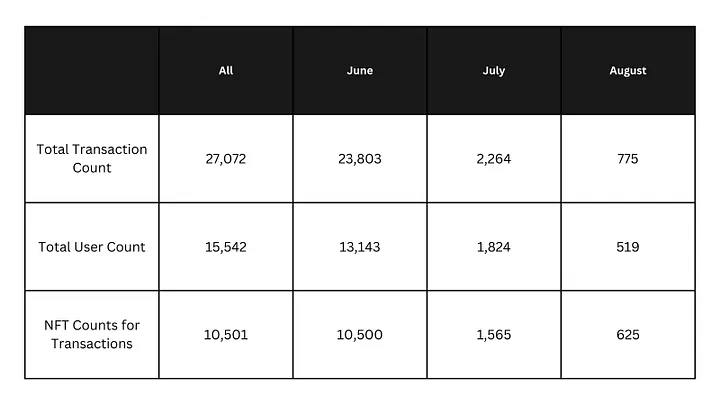
Figure 2. represents the analyzed transaction history of an NFT project for three months. Among these, June witnessed the highest number of transactions, while August had the lowest. Similarly, the number of users was at its peak in June and reached its lowest point in August. Notably, there was a significant decline in transaction volume from June to July. This decrease could be attributed to measures taken to maintain a balanced supply and demand ecosystem for the NFT project, as an excessive supply of NFTs can potentially devalue them. Consequently, certain transaction types, such as token trading, may have been restricted to ensure the smooth operation of the NFT project's supply and demand dynamics.
FIn order to maintain a healthy ecosystem for token trading, there have been attempts to permanently prohibit certain transactions. so the users who participate can trust each other. However, some malicious users exploit abnormal activities like cross-trading to artificially inflate the value of tokens, rendering the previous efforts ineffective. These malicious users tend to follow specific transaction patterns, which will be explored in the following chapter.
Transaction Data Patterns:
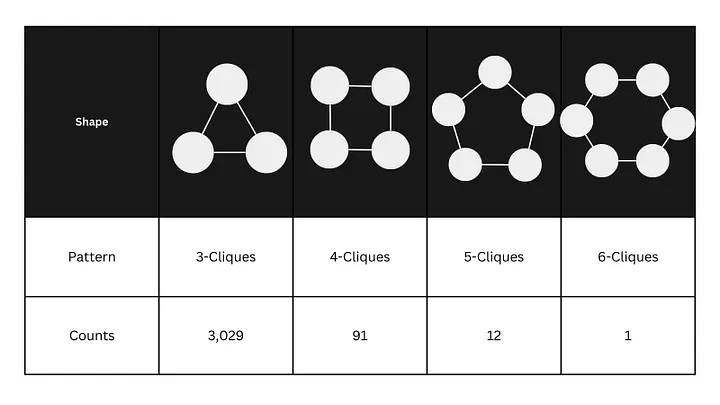
The table above illustrates the occurrence of Cross trading patterns over three months. A “3 clique” indicates that three wallets were involved in a transaction related to a single token. Similarly, 4, 5, and 6 cliques reflect different clique sizes observed when analyzing the transaction history associated with a specific token.
So what does transaction patterns do?
Although it can be challenging, only through the above patterns to conclude if all indicate malicious autobiographical transactions, identifying tokens that are part of the rotation transaction pattern alone can serve as a valuable indicator for users engaged in NFT trading. This information plays a vital role in improving community awareness and reducing information asymmetry. In summary, the lack of management and regulation in the blockchain market has led to numerous lost rotation transactions. As explained above, graph database adds a significant improvement to regulating malicious transactions through pattern identifications.
With the increased attention to NFTs, especially the recently featured NFTs as marketing strategies, we naturally expect to see increased user transactions within the ecosystem. As abnormal transactions among users can affect the community, if your businesses consider utilizing NFT, the graph database monitoring system tailored for managing NFT transactions is becoming necessary in building a healthy community.
At AGEDB , we are proudly committed to improving the technology to help advance the safety of online transactional activities. Our analysis system has undergone verification by seven academic-industry experts in Korea and received an honor from the Internet Promotion Agency President's Award. Our graph database and its monitoring system offer a compelling detection of cross-trading and transaction history management.
For more information, visit us at https://agedb.io or contact us at contact@agedb.io .