Hypergraph Visualization - What can be retrieved from a simple set of data?
What is a hypergraph?
Navigating a graph with an abundance of diverse edges can pose challenges for users aiming to swiftly identify data at first glance. In such scenarios, the hypergraph offers a solution by streamlining the complexity of multiple edges and aligning them with specific nodes. This approach facilitates users in promptly identifying the nodes associated with each edge. The distinctive features of a hypergraph encompass the following:
-
Categorization of Complex Edge Properties
Streamline intricate edge properties into a singular edge, enhancing clarity
-
Intuitive Placement of Nodes
Facilitate intuitive placement of nodes that connect multiple edges, allowing for overlapping sections.
-
Visual Representation of Edge Weight
Highlight edge weight classification by applying transparency or thickness.
-
Combination of Nodes
Express a single node by combining multiple nodes strategically
With these features, hypergraphs can efficiently transform table or graph data, enabling users to explore and search through a drilled-down approach tailored to specific purposes. To illustrate the practical application of hypergraphs and provide a better understanding, let's take a look at some examples!
Setting additional overlapping sections by certain properties
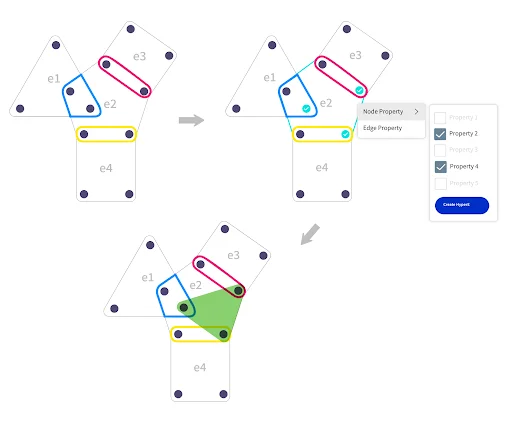
By selecting various nodes within the hyperedge 'e2,' identified as the most extensively overlapped edge, you can create supplementary overlapping sections by leveraging the properties of the chosen nodes. This process allows for the establishment of additional overlapping sections, each tailored to specific properties of interest. By iteratively generating these sections based on selected properties, valuable insights can be derived, contributing to a more nuanced understanding of the data and its inherent relationships.
Node extension and alignment
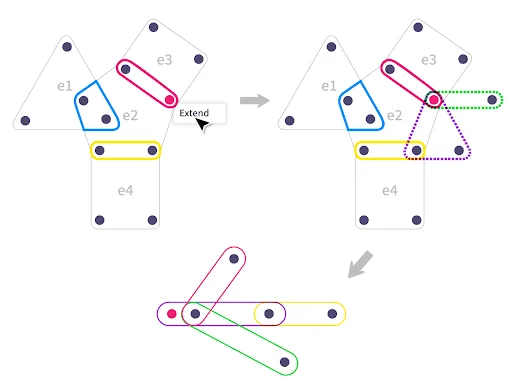
Another illustrative example involves the discovery and validation of hidden nodes and hyperedges linked to a chosen node within the Hyperedge interface. By simply right-clicking on the selected node and expanding the selection, hidden elements are unveiled. The expanded nodes and edges are then systematically organized in parallel, forming a coherent graph structure, with the connections being verified based on their respective weights.
Now, let's see these hypergraph features in real-life applications using the DVD rental dataset.
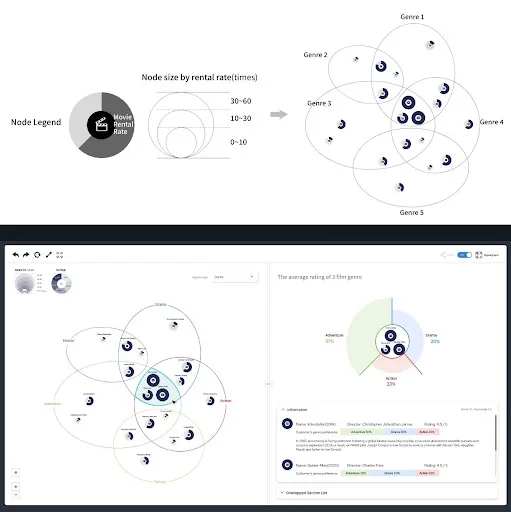
Scenario 1. The rate of DVD rentals by genre
This scenario involves analyzing the DVD rental rates among customers and identifying the movie genres to which the highly rented DVDs belong. In the context of the node, the DVD movie is depicted at the center, surrounded by a curved progress line representing its rental rate. With this structure, the design intuitively conveys the data that; as the rental rate rises, both the size of the node and the progress line dynamically fill with a black color. Whilst, hyperedge represents movie genres - Clicking on an overlapping section allows you to access the average rating of the entire movie genre, unveiling a comprehensive view. This information is then visually presented through a detailed pie chart, offering insights into the genre type and its associated details.
Scenario 2. Deriving Customer Preferences by Movie Ratings
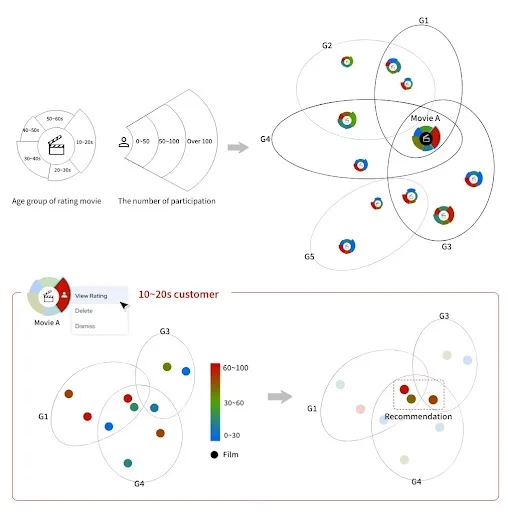
This scenario involves extracting the distinct needs of customer groups based on movie ratings, utilizing an innovative hypergraph that categorizes movies preferred by different audience groups. By employing color-coded evaluation scores, we can easily identify movies that garnered high ratings from the 10~20-year-old demographic. For instance, Movie 'A' in Figure 4. received acclaim from this age group, and its high evaluation score is visually highlighted. Leveraging this data, we can recommend similar genre films with high scores to the same audience or strategically incorporate the movie list into marketing materials for targeted promotional campaigns. This approach not only refines our understanding of customer preferences but also serves as a dynamic tool for shaping effective marketing strategies.
Scenario 3. Exploring movies impacting monthly sales of each store
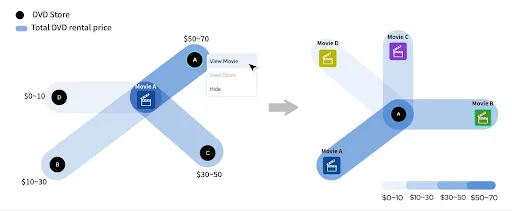
There is a hypergraph on how much the movie 'A' influences monthly sales among the top five stores. Each node indicates a DVD store, while the hyperedge represents the total DVD rental price by using the transparency effect, in which the more transparent the color is, the higher the rental price. This visualization system provides a straightforward way to gauge the impact of a specific movie on the sales performance of its associated store. Beyond concentrating on the store 'A' with the highest sales, the system enables the identification of additional movies that contribute to the monthly sales dynamics of that particular store.
Conclusion
-
Effortless Node Exploration:
Facilitate node discovery and exploration by categorizing and arranging them seamlessly across multiple categories.
-
Dynamic Visualization:
Enhance the visual representation of weighted nodes and hyperedges through the adjustment of transparency, size, and color, providing a richer understanding of the data.
-
Property-Based Connection Exploration:
Uncover the intricate connections within hyperedges by selectively choosing specific node properties, offering a nuanced perspective on relationships.
In summary, the following key points emerge:
Furthermore, the examples showcased exemplify a structured approach to searching and exploration, transitioning seamlessly from graphs to hypergraphs. Notably, hypergraphs need not solely originate from graph data; they can be directly derived from table data. By designating columns as hyperedges, a wealth of insights awaits through the exploration of detailed data associated with intersecting columns. The columns within table data act as repositories for frequently used hyperedges, efficiently managing multiple properties. This nuanced transformation from table to hypergraph signifies a versatile and powerful approach to data exploration and management.
To learn more about hypergraph and its visualization, Contact us today!