Knowledge Graphs in Action: Graphs for Seamless Data Integration
The power of data has become essential for organizations striving to make informed decisions and drive innovation. The challenges for many industries, however, lay in establishing a knowledge management system capable of intuitively connecting and making sense of the vast amount of accumulated information. In this article, we will delve into a scenario involving project management in a research and development institution.
The R&D Institute in this scenario provides economic development experiences with overseas partner countries. To establish a knowledge management system that can intuitively check the connection between various information accumulated, while examining the current status of newly applied technologies and reviewing their applicability to planning and discovery of new development cooperation projects, a graph DB with strengths in data connection relationship processing and data analysis was selected.
What prevented the pre-existing database from meeting their needs?
The project to share economic development experience followed a systematic approach, progressing through various life cycles from project discovery to performance management. However, crucial information related to development cooperation projects remained fragmented, scattered across Excel tables, until the implementation of the graph database. Owing to the absence of interconnectivity among the data tables, comprehending the relationships between diverse elements and aligning business areas and stages proved to be challenging.
The maintenance and management of tables, along with their adaption to evolving business information, incurred substantial time and financial investments. Furthermore, as attempts were made to establish connections between existing tables, the complexity of data relationships within the graph data posed a challenge. Repeated join operations led to performance issues, limiting the ability to conduct in-depth queries necessary for effective utilization of development cooperation data. In response, project information underwent a transformation through graph modeling and integration into the database to assess its suitability for constructing a knowledge system for development cooperation projects. Leveraging the capabilities of the graph database, the team explored hidden insights and intuitive values, ultimately discovering the flexibility in data management, including addition, modification, and deletion processes.
The impact of graph technology on data connectivity
The introduction of graph technology aimed to explore more efficient avenues for data connection, management, and utilization. Accordingly, this technology has been harnessed in constructing a knowledge portal to enhance work efficiency, facilitating tasks such as efficient information retrieval and tailored recommendation systems. This implementation has reaffirmed the robustness of graph technology - a technology grounded in graph databases and encompassing a spectrum of condensed capabilities, including knowledge graphs, graph analysis, and graph visualization.
What are the key offerings of Graph Database?
-
Establishment of relationship-matching system through knowledge graph
-
Property graph model optimal for knowledge information expression
-
Easily add data with schema less structure
-
Implementation of advanced analysis model using prediction algorithm
-
Intuitive Graph Visualization
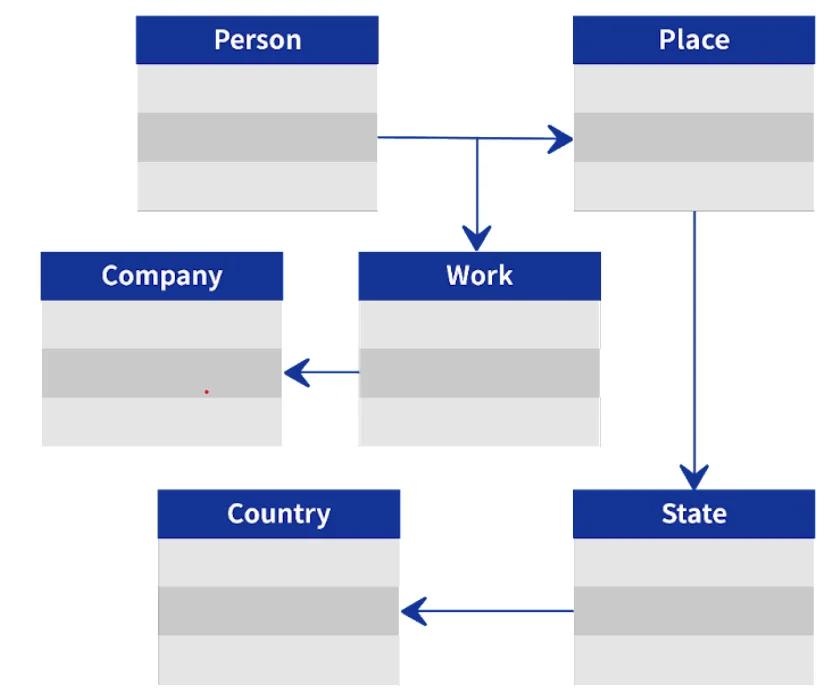
Visualization makes it easy to spot hidden patterns. Data relationship visualization has better visibility than the existing model.
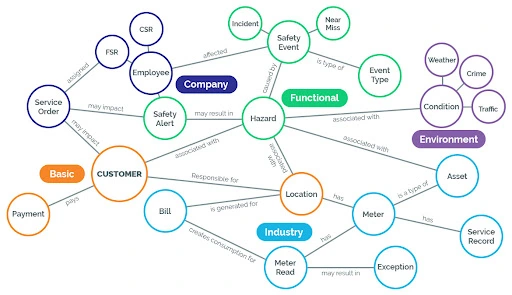
Figure 2. Intuitive Graph Data Visualization Graph databases are characterized by their flexibility in not adhering to a standardized schema, allowing for the adaptable addition of nodes, edges, properties, and more. This flexibility proves highly beneficial when the objective is to include attributes that deepen the analysis at a specific point in time.
-
Simple Graph Query Language
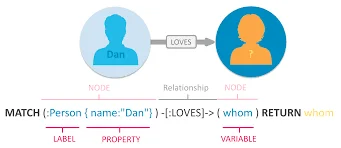
Figure 3. Simple Graph Query Language Cypher will be a graph syntax that enables efficient querying and retrieval of relational property graphs. In the past, searching through numerous documents to find information on data properties was inconvenient. However, data retrieval will become effortless thanks to the graph database that will connect all data relationships.
Competency of graph analysis skills
Graph analysis involves the analysis of data composed of nodes and edges, distinct from the analysis of conventional table-type datasets. Analyzing graph data enables comprehensive data analysis, providing new services beyond the existing statistical analysis. For instance, graph analysis algorithms like clustering and centrality can be seamlessly integrated and applied without the necessity of AI technology.
Personal information plays a pivotal role in identifying experts within a particular business or field, and it holds significant importance in development cooperation projects. Graph Databases compute an index that reveals the extent of relationships within a network of highly influential individuals through centrality analysis. With this graph algorithm analysis technique, it pinpoints individuals with high centrality, thereby identifying both experts and personnel actively engaged in project-related tasks.
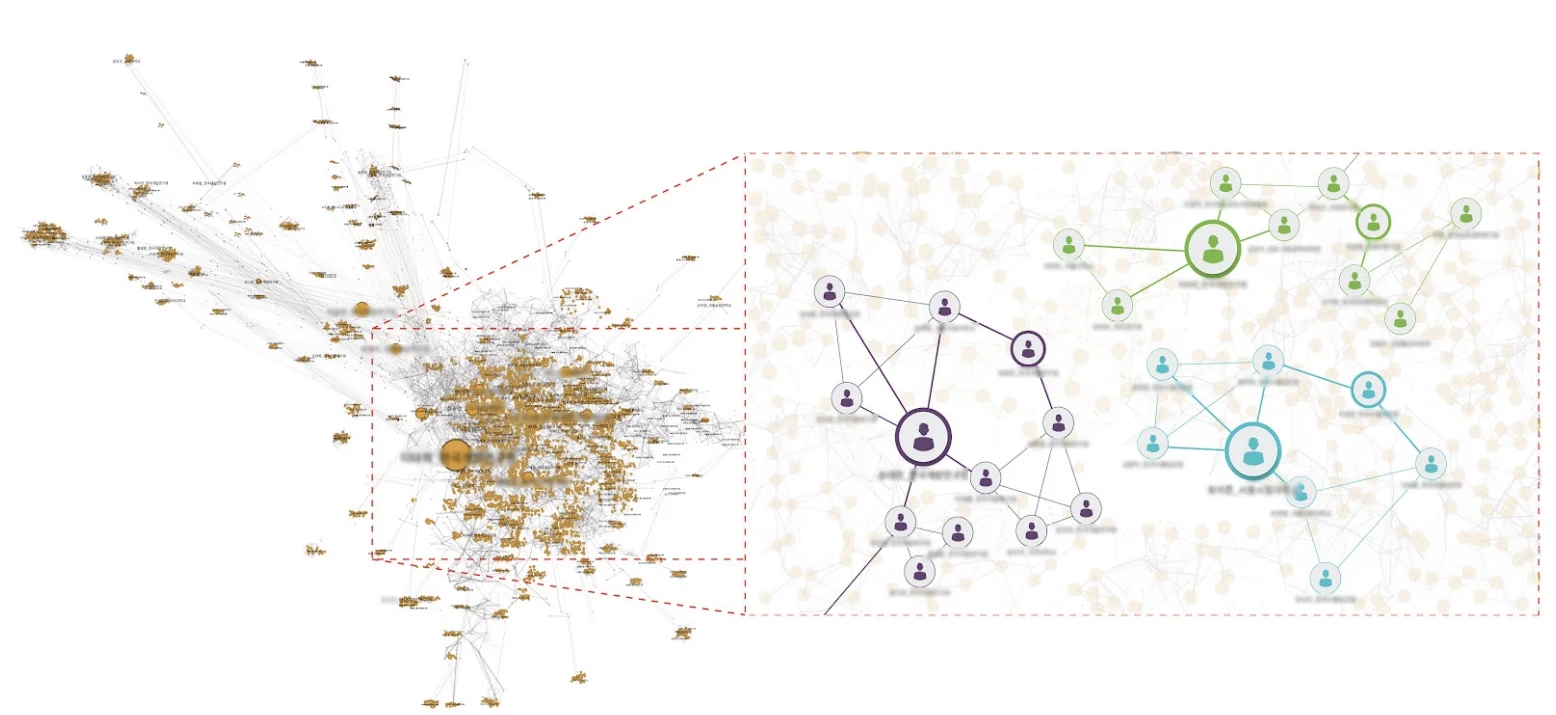
What can you expect out of Graph Extension?
Managing and analyzing diverse data types, including emails, PDF documents, images, and videos, posed a considerable challenge within our existing databases. However, these challenges were effectively surmounted with the introduction of graph technology. Thanks to the inherent capabilities of graph visualization analysis, we can now retrieve extensive volumes of large-scale graph data and zoom in on specific areas for a concentrated view. By offering both macro and micro interfaces, we have created a more robust analytical platform that fosters a deeper understanding of workflow processes, facilitating the extraction of valuable insights. The integration of graph technology will not only address existing challenges but will also open doors to new possibilities, providing a more holistic view of our data landscape and empowering us to make more informed decisions for the future.
Interested in knowing more about Knowledge Graph Implementation? Contact us today!