
The future of BOM Data Management in Manufacturing, Multi-Model RDBMS with Graph
Background
Forbes and Gartner are paying attention to graph databases as a core technology that would empower the business and work environment. In other words, graph technology is anticipated to be effective in analyzing and utilizing complex relational data in contrast to data management methods that have been used in the past
Gartner predicts that by 2025, graph technologies will be
used in 80% of data and analytics innovations, up from 10%
in 2021, facilitating rapid decision making across the
organization.
In this article, we'll discuss how a certain shipyard leveraged graph technology to improve data historical management and exploratory services while maintaining a traditional relational database. Shipbuilding companies are leading the future of the shipbuilding and marine industry with their hardware (ships, offshore plants, etc.) and software technologies utilizing AI.
It takes a lot of data such as technology, steps, and parts needed to build a vessel. When manufacturing a vessel, the purpose and the needs of the customer determine the model of the vessel. The said model consists of complex and diverse parts depending on the content of the bill of materials (BOM), which contains a collection of information about the parts included in the vessel.
Here's how a shipbuilding company revolutionized bill of materials data management by integrating the best of relational and graph databases.
Challenge
Manufacturing vessels takes a long process. When building a vessel, it is necessary to have a good solution capable of managing past records and related information for situations where related parts are updated or the information of related subcontractors changes frequently.
One of the greatest strengths of the relational DBMS used by shipbuilding companies is the ability to manage hundreds of millions of data in a table structure. However, the issue with the said systems is increasing data computation time during the table join process when performing complex and deep queries. The legacy systems of the shipbuilding company had trouble analyzing the influence and the relationship between specific services and data from over 100 million data stored in a table structure.
When design changes are required in the shipbuilding process, it is essential to check whether the partschanged actually affects other parts. If so, it is necessary to identify and analyze the influence and to what extent the connected information between a changed part affects other parts.
The shipbuilding company needed a revolutionary solution to easily view and analyze various manufacturing data and reduce the time it takes to perform transactional queries.
Solution
The relational database was maintained for storing of manufacturing data with its unique structural characteristics because that is what relational database is best at. In cases where we need to view and analyze the relationship, within the data modeling, the graph database is implemented as a service to query for such purposes.
The graph connects relationships of nodes with edges, which greatly reduces the query time to find connection between data. In the shipyard modeling below, you can search, track, and analyze data by visualizing query results.
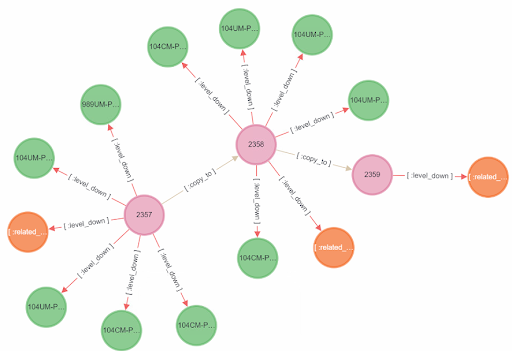
Search for models in the project
Query : MATCH(a:project) return a
( Click "2357" and expand to 5 models)
In the illustration above, assume you have a project called "2358". It consists of designs to build a vessel. You can search for the materials used to build the ship (e.g. 104CM-P, 104UM-P...) to find out which ship model the material is used for. You can also search for a vessel name to find vessel models and related projects and phases, as shown below.
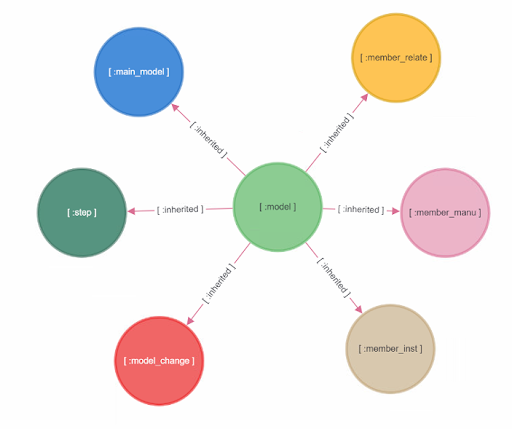
Search for a model's vessel name
Query : MATCH(a:model) where a.model_name =
989UM-PM-997
return a
(Expand the Step node in the Model's child nodes to
see the steps in turn )
There are steps to follow in order to create a vessel of a certain model. You can analyze which vessels in a particular model are related to which members and which projects they belong to. For example, you can analyze exactly how many times a particular vessel's drawings have been revised and what materials were used to solve problems or make your work more efficient.
Checking the steps of a vessel model
Benefit
We applied the advantages of both the relational and graph database technology to manage the engineering information required to build a vessel in a graph structure and the master data stored in a table structure.
AGEDB Enterprise Edition supports both relational and graph databases making it easier to connect the relationship and analyze the influence between data. It was especially helpful in tracking down the history of changes made from various stages of services. With the application of graph databases, data management services have advanced to the next level, and data that was previously managed in relational databases has become more insightful. In this use case, the graph database was not used as a replacement of relational databases, but rather, integrated with it. This marks the beginning of, as we would like to say, 'relational graph database' (RGDB), which can be used together in other similar cases. We can expect new hybrid technology for various information and data in various engineering fields, not just in the manufacturing of vessels in shipyards.