
Understanding and Tracking the Cryptocurrency Transactions using Graph Technologies
Cryptocurrency transactions have gained significant popularity in recent years, revolutionizing how we conduct financial exchanges. In this article, we will delve into the characteristics of cryptocurrency transactions and explore how graph databases can enhance their application. By understanding the power of graph databases in managing transparency and analyzing transaction data, we can unlock new possibilities for various industries.
Let's start by looking at the differences between bank and cryptocurrency transactions that we use on a daily basis.
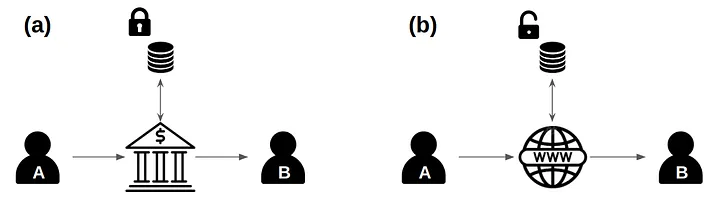
The img above shows the difference between a bank and virtual currency transactions. In the case of bank transactions, the records are encrypted in the bank server and can only be viewed by the related parties that made the transaction. Virtual currency transactions on the other hand, are released online, and all people have access to view these transactions. Transparency is a core value in blockchain technology. This transparency is also common in other transaction industries like trades. The export and import transaction process includes various processes such as invoice issuance, customs inspection, and export supervisory authority approval. The transparency in the blockchain can also detect data manipulation or fraud in advance.
In managing transparency, the graph database is an efficient method due to its specialty in searching and storing relationships. For instance, graph databases can quickly collect the relationships of people who send and receive messages via social network services. Graph Databases are also made more human-understandable through visualization tools and easy query language and make the network of relationships more visible and understandable faster.
So what happens if you use a graph database to track personal cryptocurrency transactions? When you want to look at cryptocurrency transactions, there are situations where you either have to track the flow of the transactions or trace them back. There are also times when real-time coin transactions are complicatedly connected and expanded.
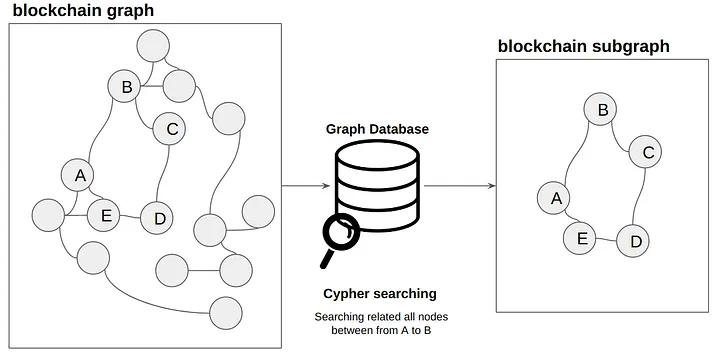
Graph Databases technology provides a technology that enables users to track and reverse relationships on these real-time expanding data. Tracking a transaction in a graph database means eventually looking up a transaction relationship of interest among the data. Let's look at how this “lookup” differs from an existing database from a graph database.
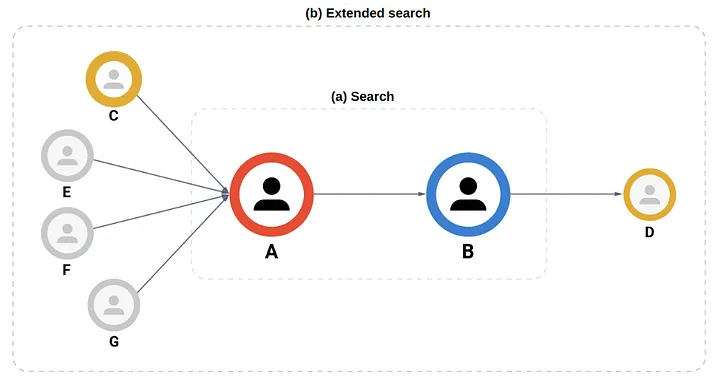
The img above shows two inquiry situations, inquiry, and extended Inquiry. There is no difference between existing database and graph database in the (a) query situation.
There is no performance difference because it simply inquires about the transaction relationship between A and B; however, there will be considerable differences when (b) inquiring about relationship information such as A and B and 'related C or D.'
While the existing database needs to be re-examined under the condition 'with C, D' in the database and systematically joins many tables for actual queries, the graph database would only need to bring in the necessary relationship with A and B, resulting in a substantial difference in speed.
When a user wants to track the whereabouts of highly relevant virtual currency transactions in several stages, they can expand the relationship and track them effectively. Through this, the extended query can explore both the backtracking of C, E, F, and G and the net tracking of D according to the transaction flow.
The most representative use case of fraud detection in the virtual currency ecosystem is distributing stolen virtual currency assets for money laundering. When transacting to the wallet, the behaviour can be identified with only a few stages of transaction relationships being visually expressed, leading to fast problem-solving.
In conclusion, using a graph database in virtual currency transactions allows anyone intuitively examines the 'transaction relationship' using open, virtual currency transaction information. A graph database specialized in relationship management is the best tool for observing and analyzing virtual currency transactions.
Based on this, the implementation of technology using a graph database to track and explore cryptocurrency transactions follows the steps below.
-
1. Data Collection
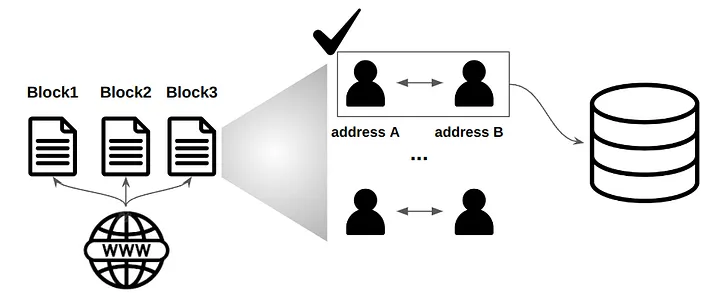
Data Collections from Blockchain Network Cryptocurrency transaction data needs to be collected. In doing so, block data by exchange and chain (e.g., Bitcoin, Ethereum, etc.) are collected in the same way as APIs, web scraping, and blockchain nodes. The collected data must include information such as sender account, recipient account, transaction amount, time, fee, transaction unique key, etc.
-
2. Graph Model Design
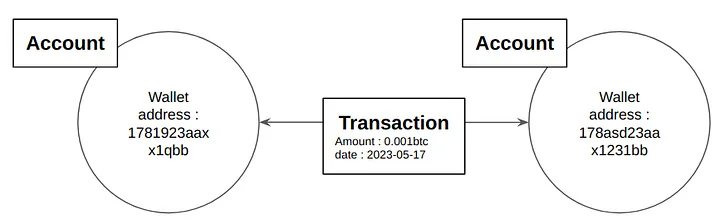
Data Collections from Blockchain Network Graph model design is a step of the graph database schema that can store cryptocurrency transaction data. The goal is to have an efficient and scalable architecture, an expandable structure to be precise. Typically, the main object (Entity) is 'Account: Node' (Transaction: Edge), and the transaction relationship between accounts is represented as transaction. Then, add the required metadata (such as, account address, balance, fees, etc.) for each node and edge.
-
3. Building a Graph Database
Application Prototyping Load data into the graph database based on the graph model schema. The Cypher query allows you to look up time series analysis, pattern matching, and cryptocurrency inflow statistics in the graph database. *Cypher query is another type of data query language, similar to SQL in relational databases. Cypher query, unlike SQL, allows more intuitive query relationship creation and its flow.
-
4. Application Development
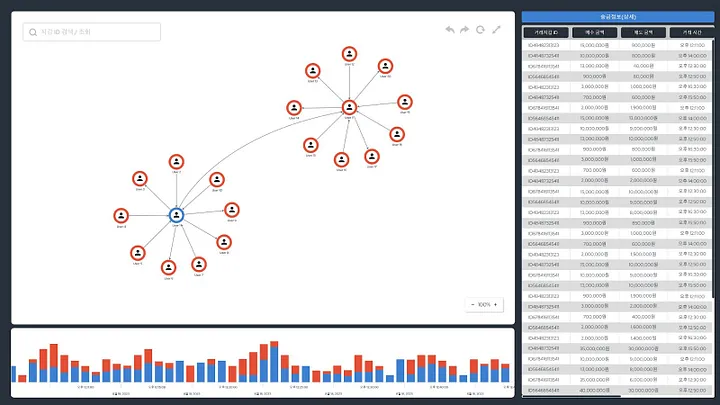
Graph Database Building Create an application by designing a UI for service users to navigate and analyze data. The data should be visualized for each user to understand the data easily. For example, users can provide transaction graphs, wallets, remittance information tables, and time-series charts.
The above img represents an application to explore the transaction relationship of a particular wallet.
To track the transaction, the instruction is as follows.
-
Enter the ID of the wallet in the upper left corner.
-
On the screen is other transactions made between the wallets. The user can explore transaction relationships that are represented in graph form. Through this intuitive visualization, one can see how many transactions have been made via the wallets.
- The table to the right records the transactions with other wallets in detail; the volume of transactions is shown in the time-series chart. and the user can check the time and date, as well as whether the virtual currency has been bought or sold through this chart.
Through these steps, the user can build and track a virtual currency transaction using graph database technology.
Interested in visualizing and managing the transactional data of your industry using graph database technology? It's time to learn more. Learn More